💼 What it does
- The statistical likelihood that a random variable lies within the confidence interval of an estimate.
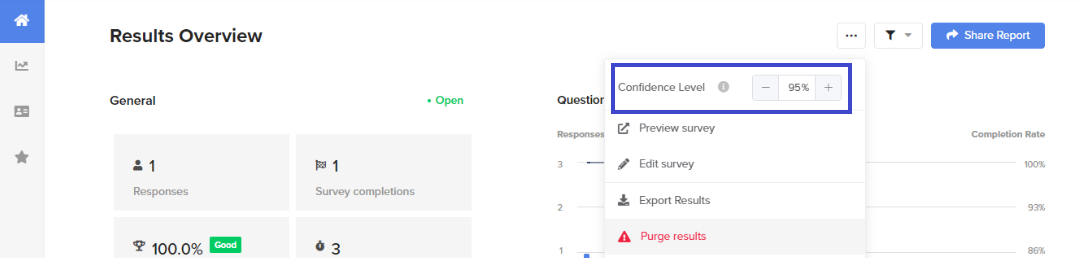
- The confidence level is represented by a percentage and this percentage indicates how confident you can be that a survey's result will capture the true opinions or attitudes of the population.
- The confidence interval is displayed as two numbers separated by a dash.
- In the case of a Segmanta survey, the confidence interval surrounding a result will only appear after that specific answer choice has at least 30 responses.
- Simply hover over the segment marker to view the confidence interval of a specific answer choice.
- The confidence interval can be affected by the confidence level you have set for your survey analysis. Generally, a higher confidence level will lead to a wider confidence interval.
Pro-tip: For example, let's say you were surveying a representative sample group made up of 1000 respondents about their attitude towards banning sugar in schools. A 95% confidence level would mean if you were to repeat the same survey, over and over again, each time with a different sample of 1,000 respondents, you can expect to experience the same survey results 95% of the time.
Pro-tip: The most commonly used and accepted confidence level is 95% and is the default setting for every survey.
🏠 Where it lives
- In Survey Analytics > Home tab, under More (...) button.