💡 This article covers
- Number of responses
- Number of survey completions
- Experience score
- Number of questions
- Question Response Dropoff graph
- Location of your survey’s respondents
- Device used by your survey’s respondents
- Browser used by your survey’s respondents
- Operating system used by your survey’s respondents
- Visual overview of your survey questions
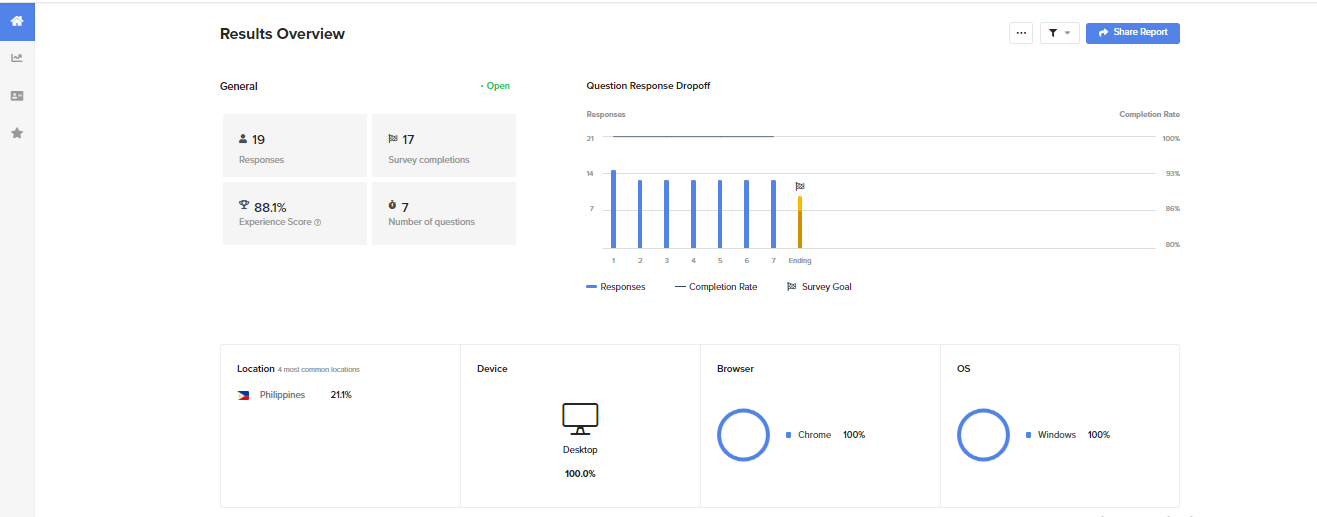
Number of responses
The total number of respondents who answered the first survey question.
Number of survey completions
The number of respondents that completed the survey or reached your determined survey goal.
Experience score
Assesses whether your survey's structure might be affecting your survey completion rate.
Pro-tip: Follow survey build best practices in order to obtain a high experience score. Here are some factors to consider when striving for a high experience score:
- Survey length
- Survey complexity
- The number of open ended questions
- How you disperse complex questions across your survey
- Survey design and content
- Where within your survey you have placed the survey goal
Number of questions
The total number of questions in your survey.
Question Response Dropoff graph
💪 When to use it
- To better understand where and how you can optimize your survey for more completions.
💼 What it does
- Provides you with the following metrics for each survey page:
- Views: The total number of respondents who viewed this question.
- Responses: The total number of respondents who answered this question.
- Completion rate: The percentage of users that completed the question.
- Additionally, it shows you where respondents dropped off in the survey.
Note: If your survey includes information pages, it will be noted in the graph with an “i” on the x-axis and a drop to 0. Don’t be alarmed by this – we simply don’t mark when a user views an information page.
🔨 How it works
- On the left side of the y-axis are the number of responses. The right side is the completion rate. If you set a survey goal, it will be noted in this graph. Multiple survey goals can similarly be noted.
Pro-tip: The graph is scrollable.
Note: The following four – location, device, browser and operating system of your respondents – change depending on what is inside the survey.
For example, if your survey includes Demographics questions, it will be regarded as a different entity. Let’s take the Demographic of age. If a question about age is included in your survey, a chart will appear with a breakdown of ages. A maximum of four interesting insights of raw data will be shown at any given time.
Location of your survey’s respondents
This is an approximate location based on the survey respondent’s IP address when they submitted their answers. The IP address is not stored anywhere within Segmanta.
Note: The three below – device, browser and operating system used – all come from the same piece of information, via a User-Agent String.
Device used by your survey’s respondents
This notes the device that your respondent took the survey on. When relevant, you will see either mobile, desktop, or tablet icons.
Browser used by your survey’s respondents
This compiles a list of browsers that your respondents used to answer the survey.
Pro-tip: For example, if you distribute your survey via Facebook, you will note that the majority of browsers used is Facebook from which the survey was completed.
Operating system used by your survey’s respondents
This breaks down which operating systems were used by the survey respondents. Those operating systems include: iOS, Android, Windows, and Mac OS X.
Visual overview of your survey questions
💼 What it does
- Shows you the survey question and the answers based on your filters and samples within your Analytics Dashboard.
- Depending on the question type you used in your survey, you will see different visualizations to best represent your survey responses.
💪 When to use it
- To get a quick understanding of the status and trends in your survey data. Each question card for more than 5 answer choices or subjects will show you the top 4-5 answer choices that respondents have selected.
- Question cards enable you to see:
- How many respondents answered each question.
- The completion rate for each question.
- The full data report per question using the Question View. Click into the question to access the detailed question page and to subsequently create segments and filters.