💼 What it does
- Sentiment Analysis is an automated process that allows you to quickly understand open ended survey responses only without any manual work.
- It classifies the responses as Negative, Neutral, Positive and quickly identifies shifts in attitudes, making it easier for you react quickly and adjust your business strategies in order to meet your audiences’s ever changing needs.
Sentiment Analysis is supported in 9 languages: Chinese (Simplified), Chinese (Traditional), English, French, German, Italian, Japanese, Korean, Portuguese (Brazilian & Continental) and Spanish.
Note: This feature is only available for Advanced & Enterprise plans.
There are two ways to view sentiment scores.
- In chart view
- In table view
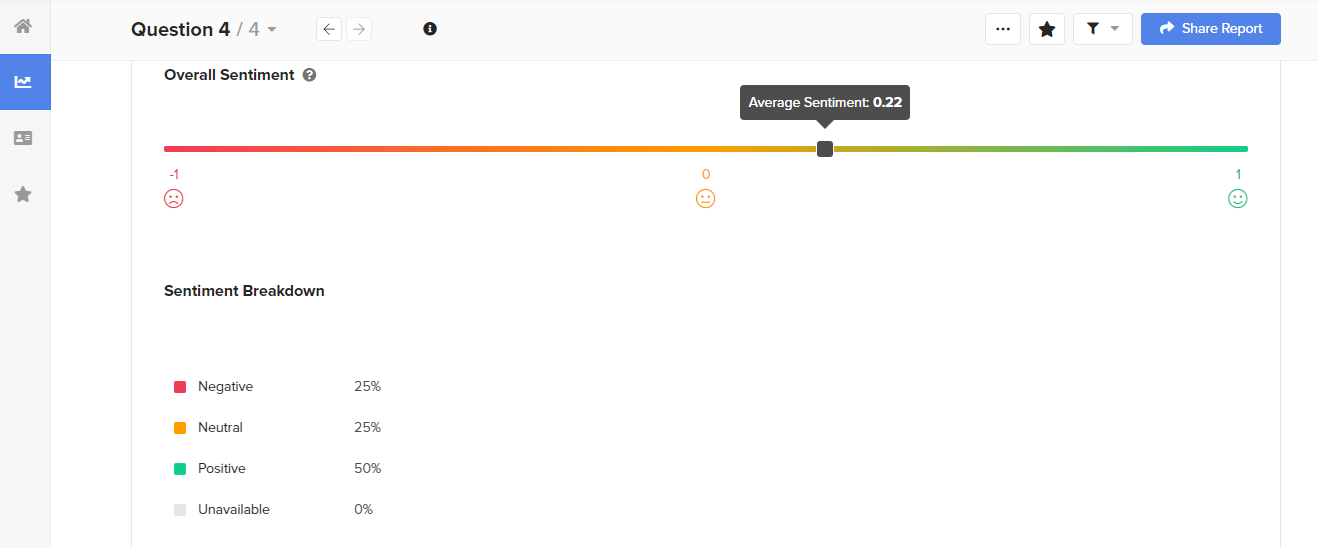
In chart view
💼 What it does
- Allows you to view the average sentiment of your survey responses and easily compare and contrast segments of your data.
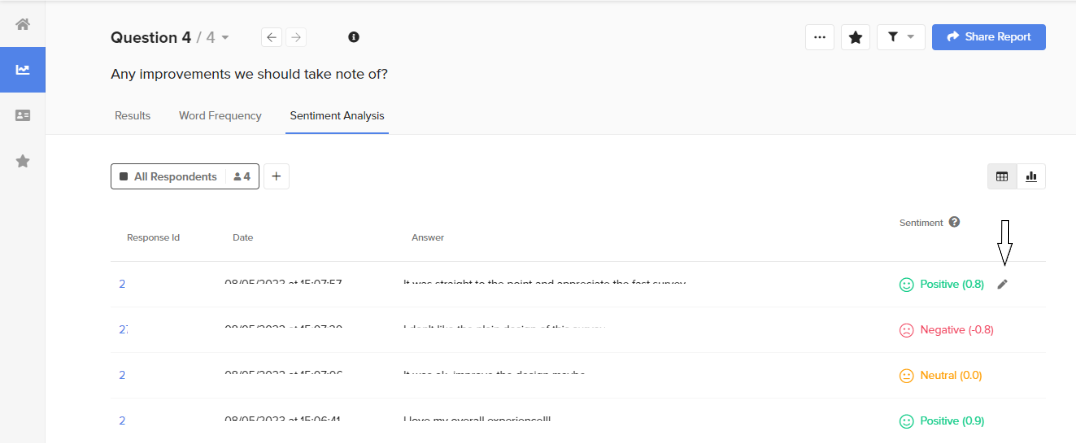
In table view
💼 What it does
- Displays the sentiment assigned to each individual response.
🔨 How it works
- Edit the sentiment of a response if you feel it should be adjusted after manual analysis.
- To adjust the scoring scale for the response, click on the pencil icon.
- Then, adjust the scale for the response according to your own scoring method.

- To adjust the scoring scale for the response, click on the pencil icon.