💡 This article covers
- What are segments and how do they work?
- How to export segmented results to Excel
- Example of a segment
💼 What it does
- Located within the Results tab, this function allows you to take a subsection of data and project it against your entire cohort.
- A cohort is defined as the group of respondents sampled. Separate cohorts can be created based on pieces of information in order to compare the cohorts, for example.
Introduction to segments
Segments can be filtered based on a variety of parameters that have populated inside of your survey, such as:
- Demographics
- Questions
- Ending
- Responses
- Custom parameters
- Views
- Quotas
- Metadata
- Time ranges
You can add up to 13 segments with unlimited filters. While you navigate through the rest of the survey questions, the segments will remain in place so you can continue analyzing the survey based on the breakdown you created.
After creating segments, save your view for easy future access by adding the page with the segments to the Saved Reports tab.
🏠 Where it lives
- Within your Analytics Dashboard, navigate from the Results Overview to the Question View.
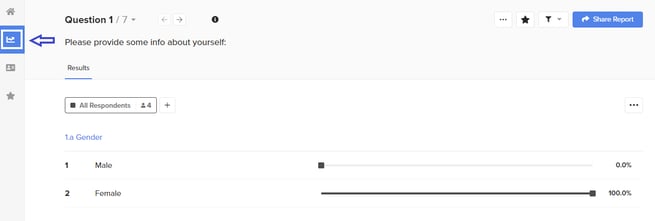
🔨 How it works
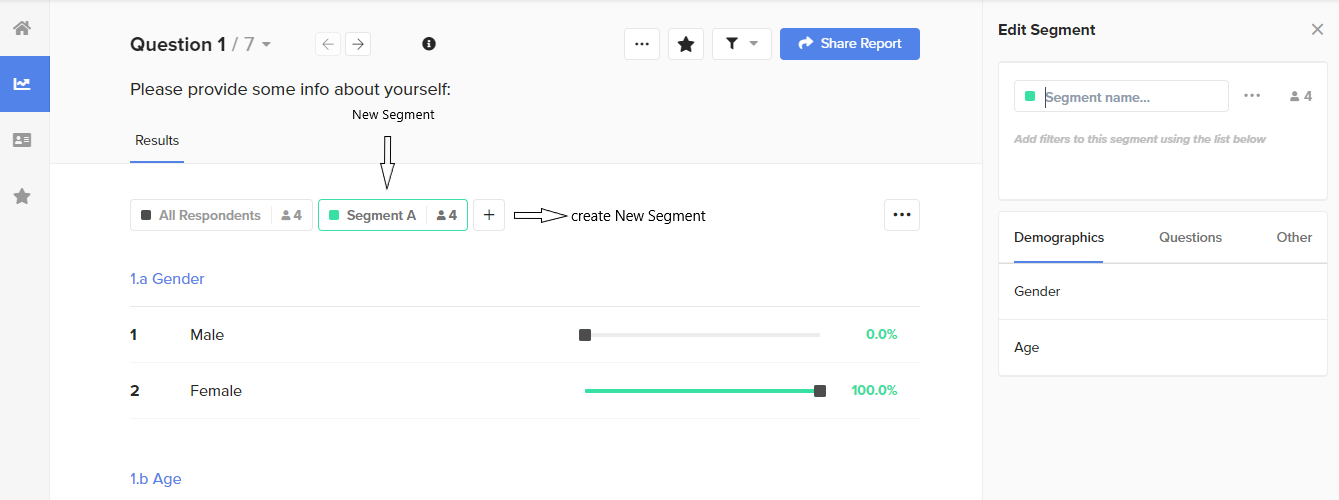
- Click + next to “All Respondents” to add a segment.
- The Segment Editor will open on the right side of the screen. A segment name will automatically be created according to the first filters you add. There is a character limit so the name will only include the first few segments. You can customize your segment name by clicking into the text field at the top of the Segment Editor and typing a custom name.
Pro-tip: This name will help you to easily identify your segment while analyzing your survey and sharing the report with your colleagues.
- To select the filters to be included in the segment, click on a Filter category (Demographics, Questions, Parameters, Other). You can select a combination of any of the data that you see inside of the Segment Editor.
- To analyze the way respondents answered each question compared to the average or additional segments, click the segment button representing each segment to:
- View responses for the segment independently, or
- Select All Respondents to view unfiltered question results.
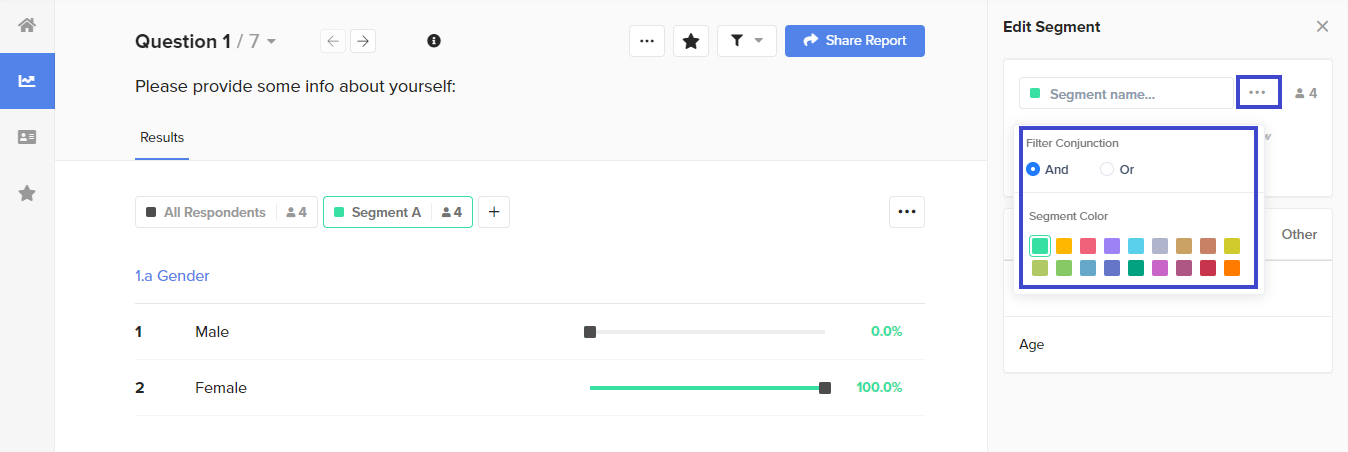
- You can further customize your segments by clicking the three dots next to segment name within the Segment Editor. Those customization capabilities include:
- Filter Conjunction: When adding filters, you can select one or more attributes/answers to create a grouped filter. The relationship between these items will be "Or". You can add additional filters by selecting another filter category and selecting attributes or answer choices for that filter. By default your filters will have an "And" relationship, meaning that the segment will display any respondent who meets the criteria of all filters you have implemented.
Pro-tip:
And: The intersection of all filters inside of the segment. A respondent will only be included in the segment if they comply with all of the segment's filters.
Or: The union of filters inside of the segment. A respondent will be included in the segment if they comply with any of the segment's filters.
-
- Color: Here, you can change the color that your segment button, segment marker and segment line will appear as throughout the dashboard.
- Color: Here, you can change the color that your segment button, segment marker and segment line will appear as throughout the dashboard.
-
You can switch the precedence of the questions by selecting the segment that is most important to you.
-
Make sure to save your view for easy future access by adding the page with the segments to the saved reports tab.
- Segments can be edited by hovering over it and clicking the “pencil” icon. The segment can also be duplicated. A segment can also be hidden if it is not important to your visualization. Lastly, a segment can be deleted if you no longer need it.
Exporting segmented results to Excel
When exporting results, and if you have defined segments, those segments will appear in the export.
🔨 How it works
- Create the desired Segments.
- Export Results by clicking the three dots (...) button located on the top right toolbar.
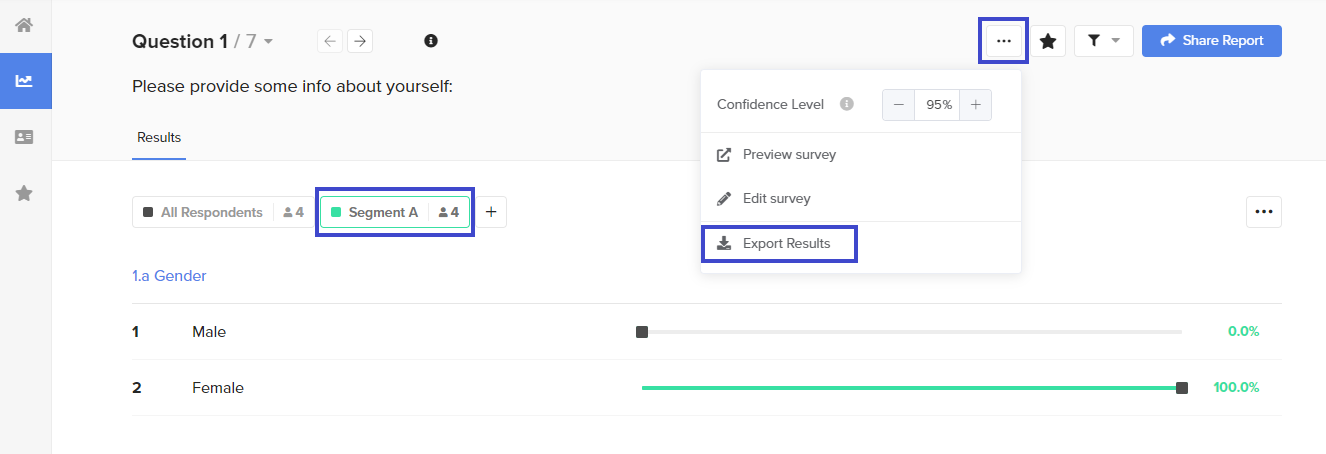
- Select the Export Type and click Export.
- You will receive an email with the exported data file with the segmented results.
- The first tab will display all respondents who answered the question you are currently viewing.
- The second tab will include the segmented survey results.
- Additional tabs for each segment with one tab for each segment that you have created on the dashboard.
Creating a segment of "18-24 Female, combination skin”
To better help you understand segments and learn how to create them, we've devised an example.
- Within Demographics, enter the Gender tab and select Female. Your segment will automatically be named according to the first filters you add. There is a character limit on the segment name so the name will only include the first few segments.
- Note the number of respondents dropped significantly, with males now excluded. Do the same for the Age tab, by selecting 18-24.
- Then, enter the Questions tab. Within the question, “What is your skin type?” select “Combination”. Note the number of respondents for this question is 5, however, only 1 respondent in total fit the other segments you had selected – gender and age.
- Now, you can see your segment on the left-hand side. Note that the color of your created segment correlates with the question visualization. Compare this to “All respondents” in black, which is the complete cohort.